

Change can take us by surprise
Andrew Papworth looks at generational changes that could affect the way people think about legacies.
- Written by
- Andrew Papworth
- Added
- April 10, 2013

You know how it is with your kids – you see them every day and hardly notice that they are growing up except for the landmarks – their first words, their first teeth, their first steps, etc. Then, along comes someone who hasn’t seen them for a while and says, ‘My! Hasn’t little Chardonnay grown up!’ It’s a bit like that with our society; we’re so busy living our lives that we often hardly notice the seismic shifts taking place around us.
In the UK, the insurance and investment company Legal & General have published a fascinating report called Big Dreams, Limited Means – From Stable Security to Fragile Wealth. Its imaginative concept is to compare the lives of typical 35-year-olds in 1977 and 2012 and to speculate a bit about 35-year-olds in 2047.

The report is interesting to those wishing to attract legacies
These 35-year shifts highlight the generational changes. Some of them are quite startling – but, equally, there is surprise at how some attitudes and behaviours that we might have expected to have changed have remained pretty solid despite all the social and economic upheaval.
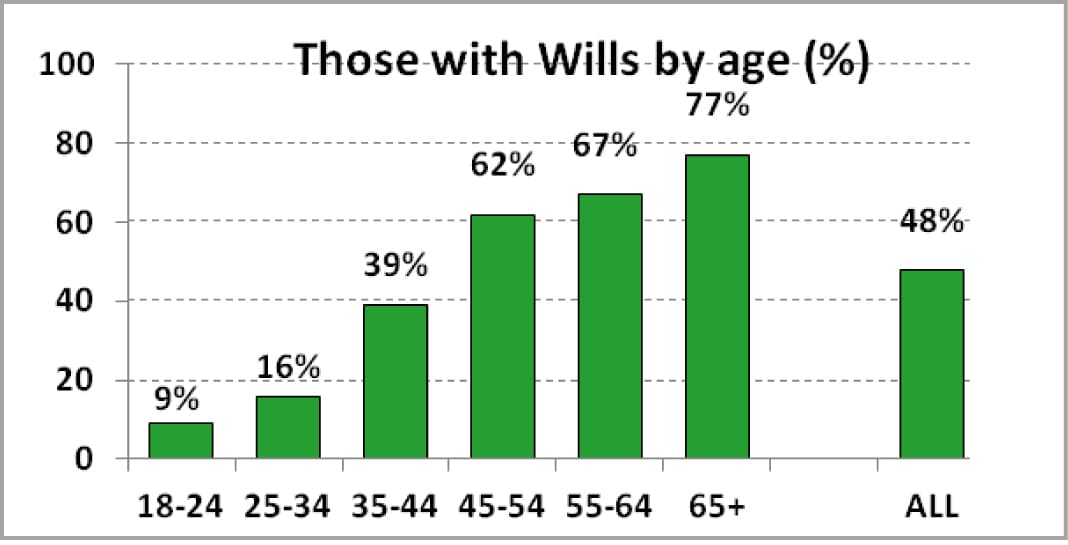
The report should be of interest to any fundraiser or charity marketer but particularly to those interested in attracting legacies. The 35-year time span is particularly relevant to legacy marketing because, in the normal course of events, if you had persuaded a 35-year-old in 1977 to write you into a will, you could be expecting to benefit any time soon. They quote research from another UK-based organisation, Standard Life, (below) showing that 35 is just on the cusp of the will-making cycle.
The following chart is re-fashioned from one that appears in the L&G report. It maps the key life-stages of typical 35-year-olds in 1977 (on the left) and 2012 (on the right).
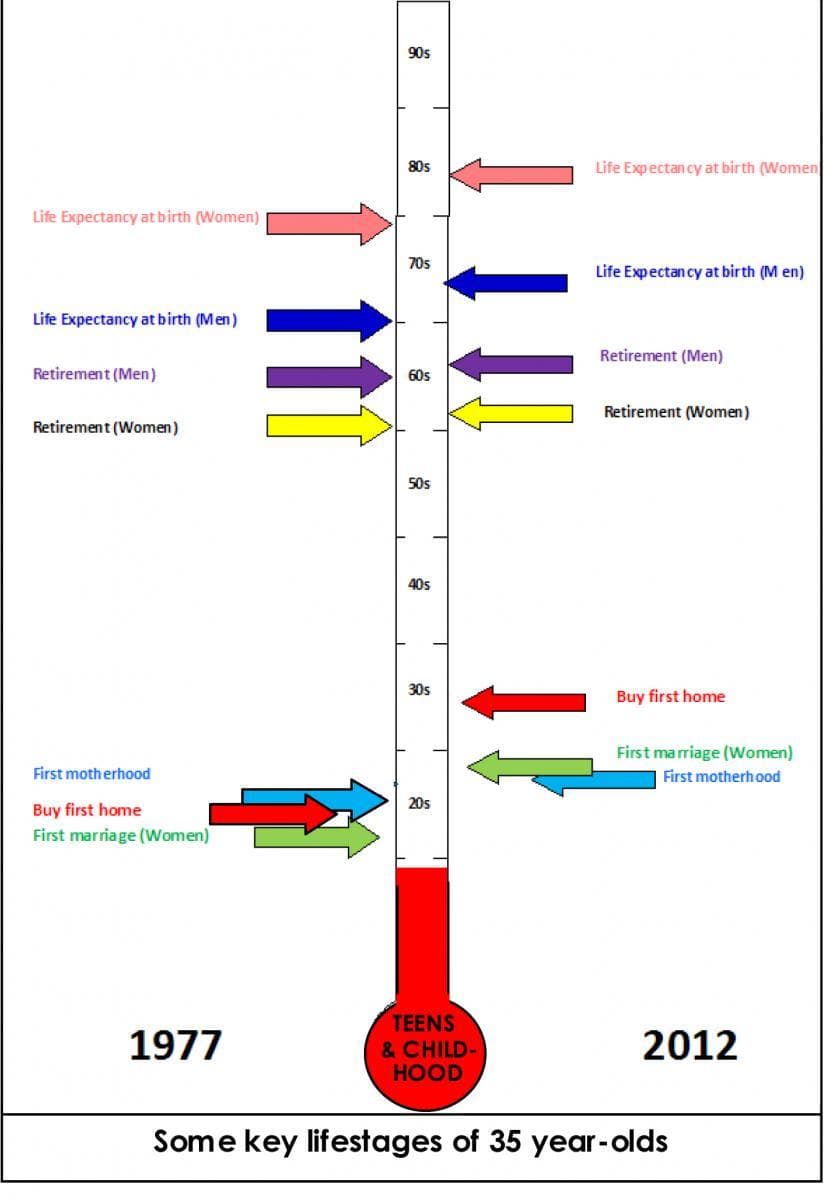
First, the things that haven’t changed much:
- Women still tend to have their first child at about the same time, in their mid- to late twenties. Although in 1977 they were likely to have been married for a few years whereas in 2012 they were likely to marry a year or two after giving birth.
- Retirement ages for both men and women were only slightly delayed (although by 2047 there will be greater equalisation and delay).
Apart from the later dates of first marriage, the other big changes were the purchase of a first home – delayed from the mid-twenties to mid-thirties) – and extended life expectancy. In 1977 life expectancy at birth for males was just above 70 and for females just below 80. By 2012 it had risen to the mid-seventies for males and mid-eighties for females.
Not shown on the chart is the fact that people are entering the workforce much later, particularly women, as a result of more students staying on through secondary and tertiary education. Between 1960 and 2000 the number of men with first degrees rose by 652 per cent, but the number of women with such degrees jumped by 2391 per cent. Many 35-year-olds in 2012 started their working lives five to six years later than their counterparts in 1977.
Also there is increasing employment promiscuity. As the report says, ‘For many people, particularly for those under 40, the idea of a “job for life” is something that has been consigned to the past.’ The research showed that 35- to 44-year-olds on average had already had more jobs than the over 65s, who had twice their lengths of working lives.
It is important to understand the effect of change
The report also refers to research by the recruitment group Hays, which showed that the current generation of 35- to 44-year-olds were much more likely to switch jobs if made a better offer than any of the older generations and that 45- to 54-year-olds were least likely to do so.
It is important to understand these and other changes that the report discusses because they have a profound influence on the ways the coming generations will approach the accumulation and use of wealth.
The chart below – also adapted from one in the L&G report – shows, in perhaps over-simplified form, how the transmission of wealth is changing over the generations. For 35-year-olds in 1977 it was relatively simple; they saved and bought a home during their working years, lived on their savings and maybe on the increased equity in their homes during their retirement and – when they died – they passed what remained on to the next generation.
L&G argue that generally in the 70s your parents supported you until you left home, then you started work and paid taxes, national insurance and pension contributions until you retired and then largely expected the state to support you.
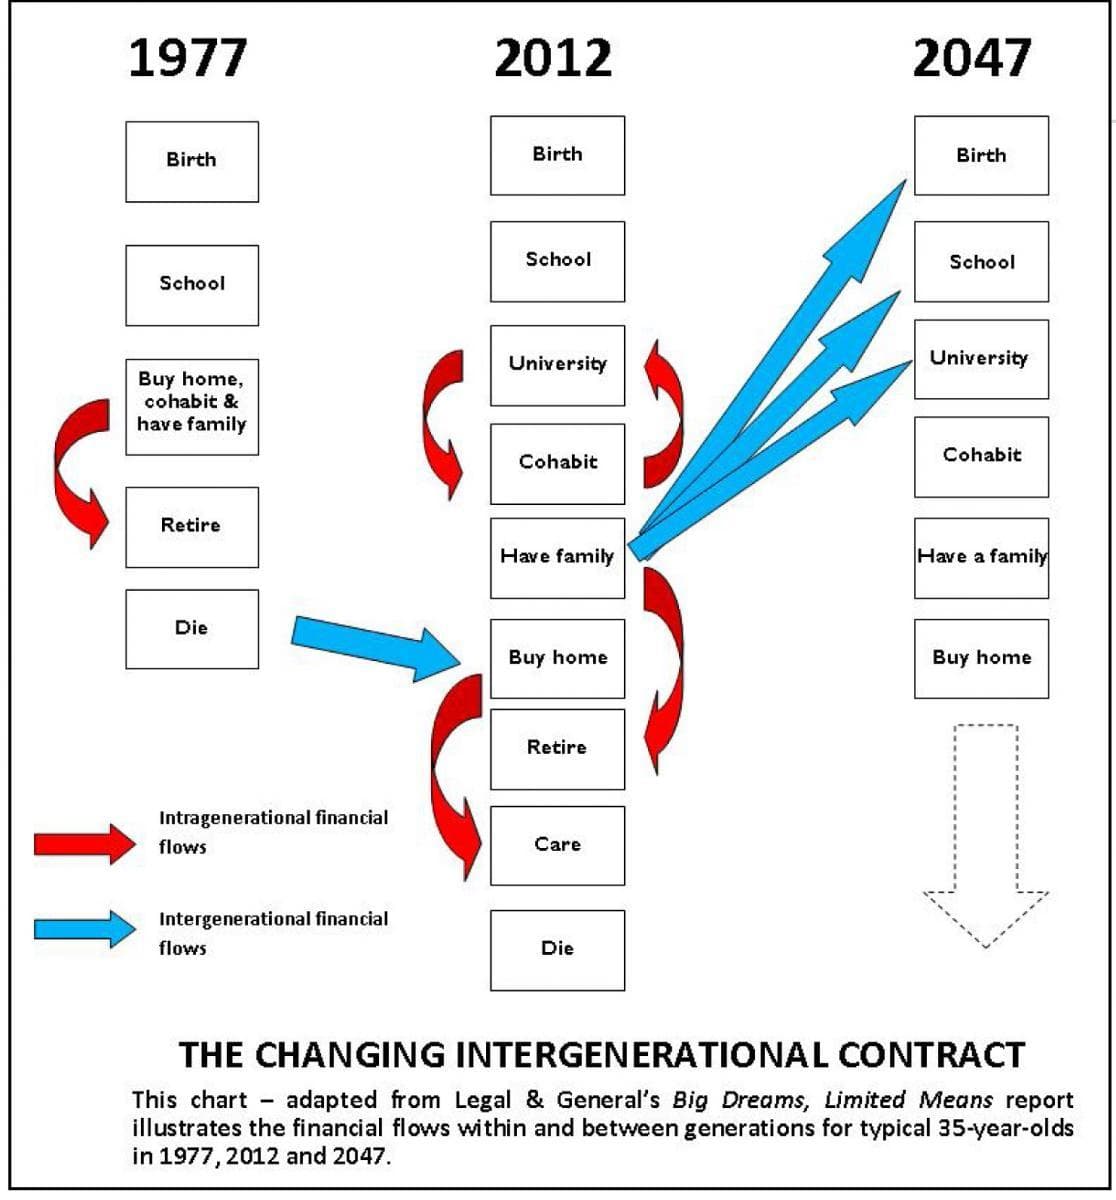

By 2012 things were much more complicated. University education had to be paid for as well as contributing to eventual earning power. In addition to making provision for longer retirement, there was increasing awareness of the probable need to fund care in old age. On top of all this there is growing reliance on the ‘bank of mum and dad’ to help children and grandchildren with their education, their first cars and purchase of first homes, etc, along with free grand-parental childcare.
The state is in retreat and people are having to fend for themselves to a much greater extent. There is much greater willingness to move money between generations via substantial gifts during the lifetimes of givers. But this generation also was much more likely to inherit substantial amounts from the previous generation based on long-term rising house prices.
Why is all this of importance to charity marketers? First of all, the more pressure there is on intra- and inter-generational shifts of wealth during lifetimes, the less may be available in estates and there may be even greater reluctance to pass whatever is left outside the family.
Perhaps in a desire to keep their arguments relatively simple, the L&G report hardly mentions the impact of relationship breakdowns and serial family building. The old cliché of a typical ‘household with 1.8 children’ may remain true, but individuals may well increasingly have 1.8 children with one partner and another 1.8 children with a new partner. This puts increasing pressure on generational wealth flow and further complicates the issue of who gets what after death.
Those charities that have traditionally relied heavily on legacy income may find this report disturbing. It looks as if we have passed through the land of milk and honey and could be heading for the parched desert where – with reducing faith in the ability or desire of the state to provide – it becomes much harder to persuade people to leave significant amounts of money outside their immediate families. Perhaps those charities need to be spending more time, effort and money on developing other streams of voluntary income.