Don’t take research findings at face value
You are always being encouraged to know your donors, who they are and why they give. Research is a good way to learn this. But, warns Andrew Papworth, you should be suspicious if, like the findings here, full methodology isn’t given.
- Written by
- Andrew Papworth
- Added
- May 15, 2013
A great deal of publicity was recently given to the findings of some research carried out on behalf of a financial services company called Foresters UK by the Wriglesworth Consultancy. They produced a report called the Charitable Giving Index said to be based on an online survey of 1,100 adults.
On the face of it this seems to be a fairly robust sample but little information was given about the methodology. It turns out that they sent out 11,000 questionnaires by email to people who had agreed to participate in online surveys and got about a 10 per cent response.
For some issues this may be adequate, but Wriglesworth/Foresters chose to major on the differences in giving between over 65s and the rest of the population.
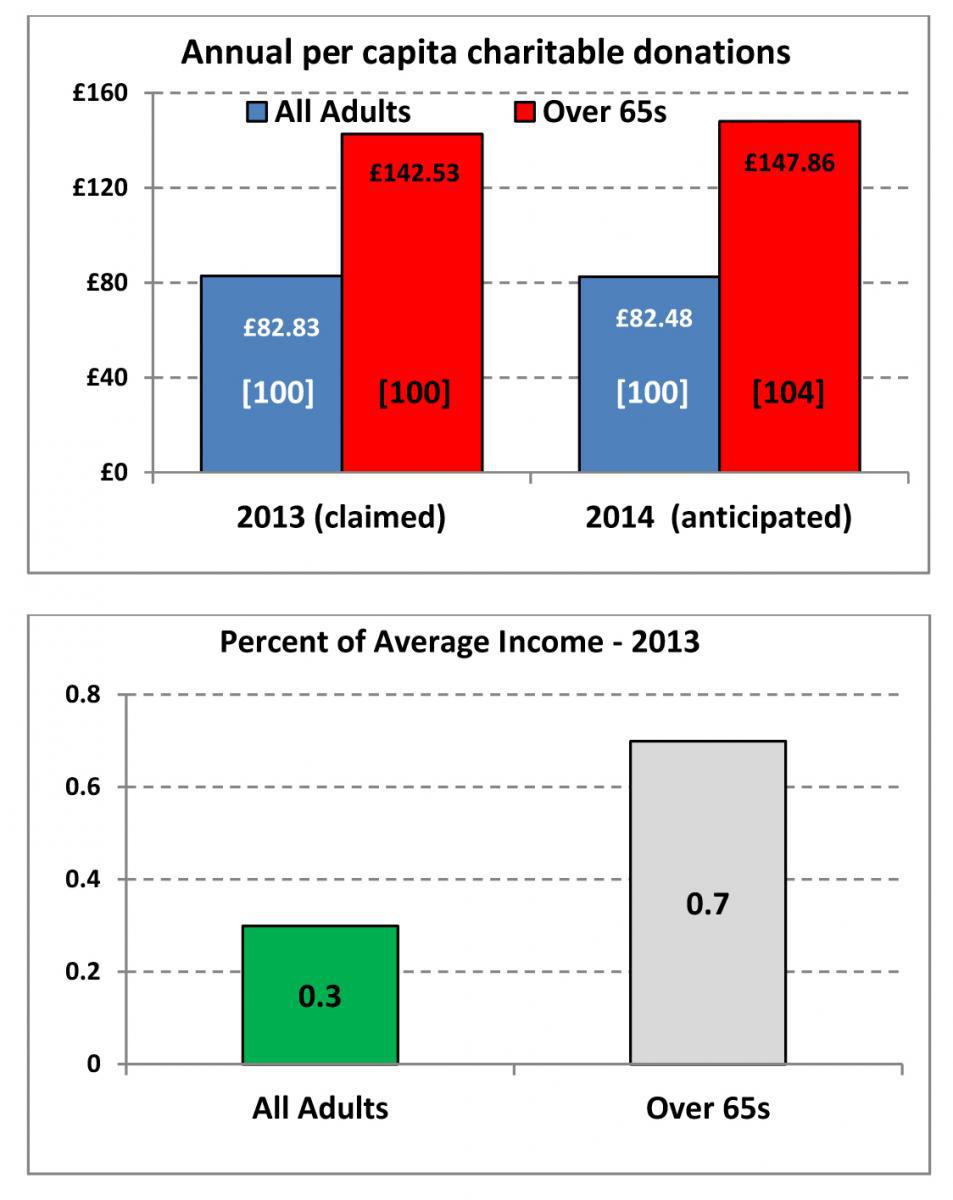
As the top chart on the right shows, their figures claim that over 65s are giving 70 per cent more than the average this year and expect to give about four per cent more next year compared with a more or less static average. They went on to express the average giving as a percentage of average incomes as reported by the Office for National Statistics, claiming that the average was 0.3 per cent but that over 65s gave 0.7 per cent (see image below).
A great deal of publicity was recently given to the findings of some research carried out on behalf of a financial services company called Foresters UK by the Wriglesworth Consultancy. They produced a report called the Charitable Giving Index said to be based on an online survey of 1,100 adults.
On the face of it this seems to be a fairly robust sample but little information was given about the methodology. It turns out that they sent out 11,000 questionnaires by email to people who had agreed to participate in online surveys and got about a 10 per cent response.
For some issues this may be adequate, but Wriglesworth/Foresters chose to major on the differences in giving between over 65s and the rest of the population.
As the top chart on the right shows, their figures claim that over 65s are giving 70 per cent more than the average this year and expect to give about four per cent more next year compared with a more or less static average. They went on to express the average giving as a percentage of average incomes as reported by the Office for National Statistics, claiming that the average was 0.3 per cent but that over 65s gave 0.7 per cent (see lower right-hand chart).
This backs up a strongly held belief of mine – the importance of ‘oldies’ to fundraisers and the dangers of relying on digital fundraising methods, which pass by many of them. So why do I think it is a piece of work that should be ignored?
The main problem with the Wriglesworth/Foresters research is that it is well established that over 65s have low access to the Internet and that even when they have access they are infrequent users using limited methods. It is inevitable, therefore, that those over 65s who participated in this survey will have been atypical of the majority of over 65s. So it is likely to be misleading to project their behaviour onto the whole age group.
Their higher than average giving is likely to be correlated with factors other than their age such as affluence, education, socio-demographic grade, etc, making nonsense of these findings.
To relate, as they do, the giving of these computer literate over 65 year olds to the incomes of all people over 65 is clearly barmy. Those 65 year olds with the technology, interest and skills to participate are by definition likely to have higher than average incomes for their age group, so their giving as a percentage of income is bound to be closer to the all-adult average.
Sadly there are too many sloppily conducted surveys in the sector. Too many companies and organisations think that an online survey is a good way to get some PR. Always be suspicious if they don’t include a full methodology – including response rate and sample profile – and a questionnaire.