Eight easy steps to calculate profitability, donor-by-donor
- Written by
- John Sauvé-Rodd
- Added
- May 21, 2012
- You have to start by knowing all your costs, not just direct costs. Requests for costs often brings sighs, scratching of heads and ‘I’ll get back to you’, but persist, for you must have this information, including salaries, overheads, everything.
- Then build a costs model and apply all costs to donor gross revenue for each and every donor - the results will be shocking, startling and revealing.
- Your costs model should be set up in three layers.
C1 – direct costs, where most of the money goes.
C2 – salaries, any social insurance, or training costs.
C3 – your share of overheads such as heat, light, insurance, corporate charges and the like.
Then, deduct these three from gross revenues to obtain net profit (P), which will result in three profit levels.
P1 – the profit on direct costs.
P2 – including salaries.
P3 – with all overheads included.
You need all three profit levels if you are to truly understand how profit (and loss) works at the donor level. - Revelation: you will find that some donors are costing you a packet. These should be dealt with kindly and in an ethical manner but shouldn’t lead you to pour money down the drain. If practical, do deals with campaigns, legacies and others in your organisation to make the best use of these ‘low-profit / no profit’ donors.
- With the saved costs, open up a high profit donor section (but call it something more imaginative) and focus on the donors who really, really count; steward them (whatever that means to you), pay more attention to them and invest in them.
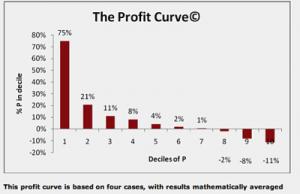
- The profitability curve: When you arrange donors by high to low profit you will find that the resulting bar chart is a sloping shape, high on the left and low on the right. It will show that most of your profit comes from the top 20-30% of your donors. This curve is quite predictable, as my research papers show (see below about how to get them). So for example, if you change job, you can say with some confidence what the profit curve should look like in your new organisation.
- Timescale: you can test out the concept of profit calculations using only one year’s worth of data, but it is better done over three to five years (if you have the data). Database systems for fundraising do not usually have the data structures needed to work out donor profitability; you can try Excel, though tools such as SPSS Base do a better job of aggregation and statistical/mathematical analysis.
- Make donor-level profitability a central core of your fundraising strategy; try beginning your planning documents with these words and take it as far as you can: “All donors are important to us, but we realise that some donors are far more important, financially, than the general throng. From now on, therefore, all our activities in individual fundraising will be driven primarily by considerations of profitability, including, for the first time, calculations for individual donors based on their giving level. This will be part of a new strategic realisation: that it isn’t the volume of donors that counts, it is the net margin that matters.”
John’s research papers on Profitability (Part 1 & Part 2) can be obtained from the author at johnsauverodd@aol.com. Part 3, about the display and visual modelling of profitability, titled ‘Profitability Dashboards’, will be published at the end of 2008.
John Sauvé-Rodd,
Director, Datapreneurs,
London & International
London office: +44(0)208 742 1131.
Cellphone: +44(0)7712 00 3232.